The Brief
Britain has one of the best records in the world for road casualties. However, hundreds still die on the roads every year. In 2010, the police recorded 1,850 deaths, 22,660 people seriously injured and 184,138 who received light injuries.
The visual journalism team had access to 12 years of road accident data, we wanted to tell the story if road deaths and make it personal to the user.
Delivery
+ A rich multi-faceted experience that brings the story in to the context of the lives of the reader
+ Including a video showing 12 years of road crash data on a map
+ Graphics that highlighted the key stories with in the data set
About the map: Using official data recorded by police in Great Britain between 1999 and 2010, we have plotted every road collision in which someone died. In all, 36,371 fatalities are marked on this interactive map. You will also find partial data for Northern Ireland, for 2004-2009.
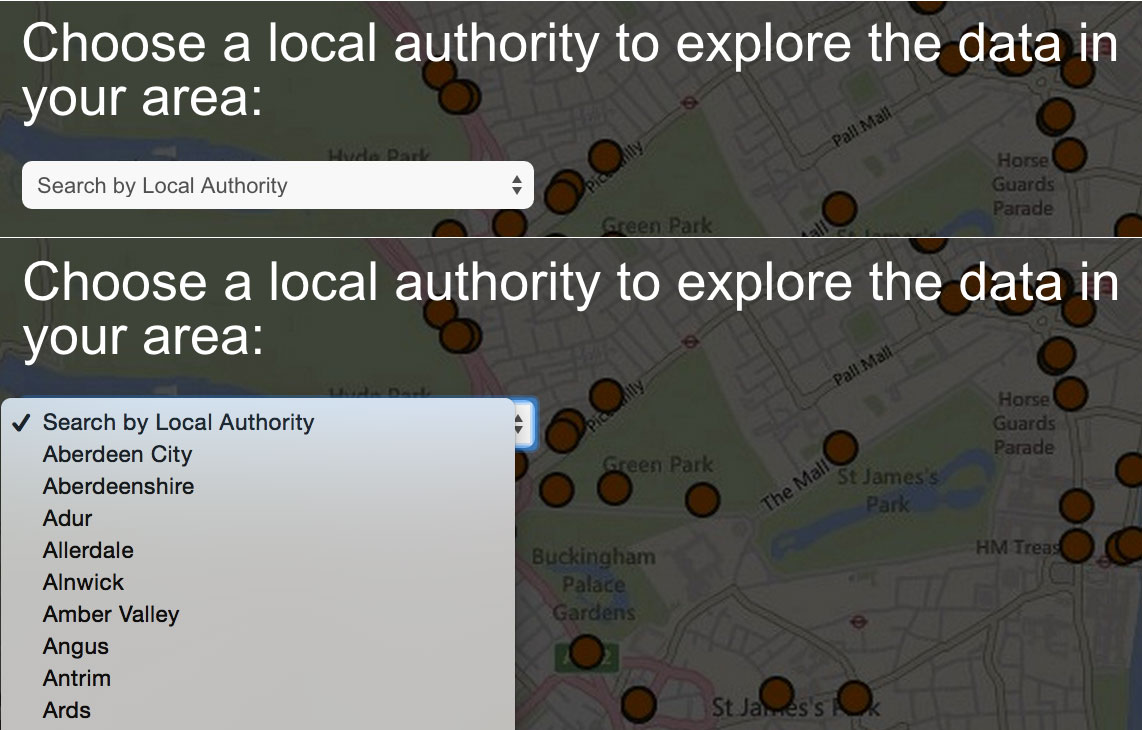 Deadlines and development resource meant that the best solution in this instance was a map searchable by local authority. The lack of an existing database meant there would not have been enough time to create a fully searchable database that functioned with Bing maps.
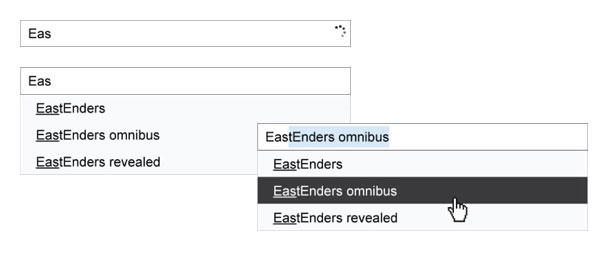
A better and more effective solution would have been to use auto suggest search. The user could then quickly type in a location by area or postcode. This could be used alongside a dropdown of local authorities.
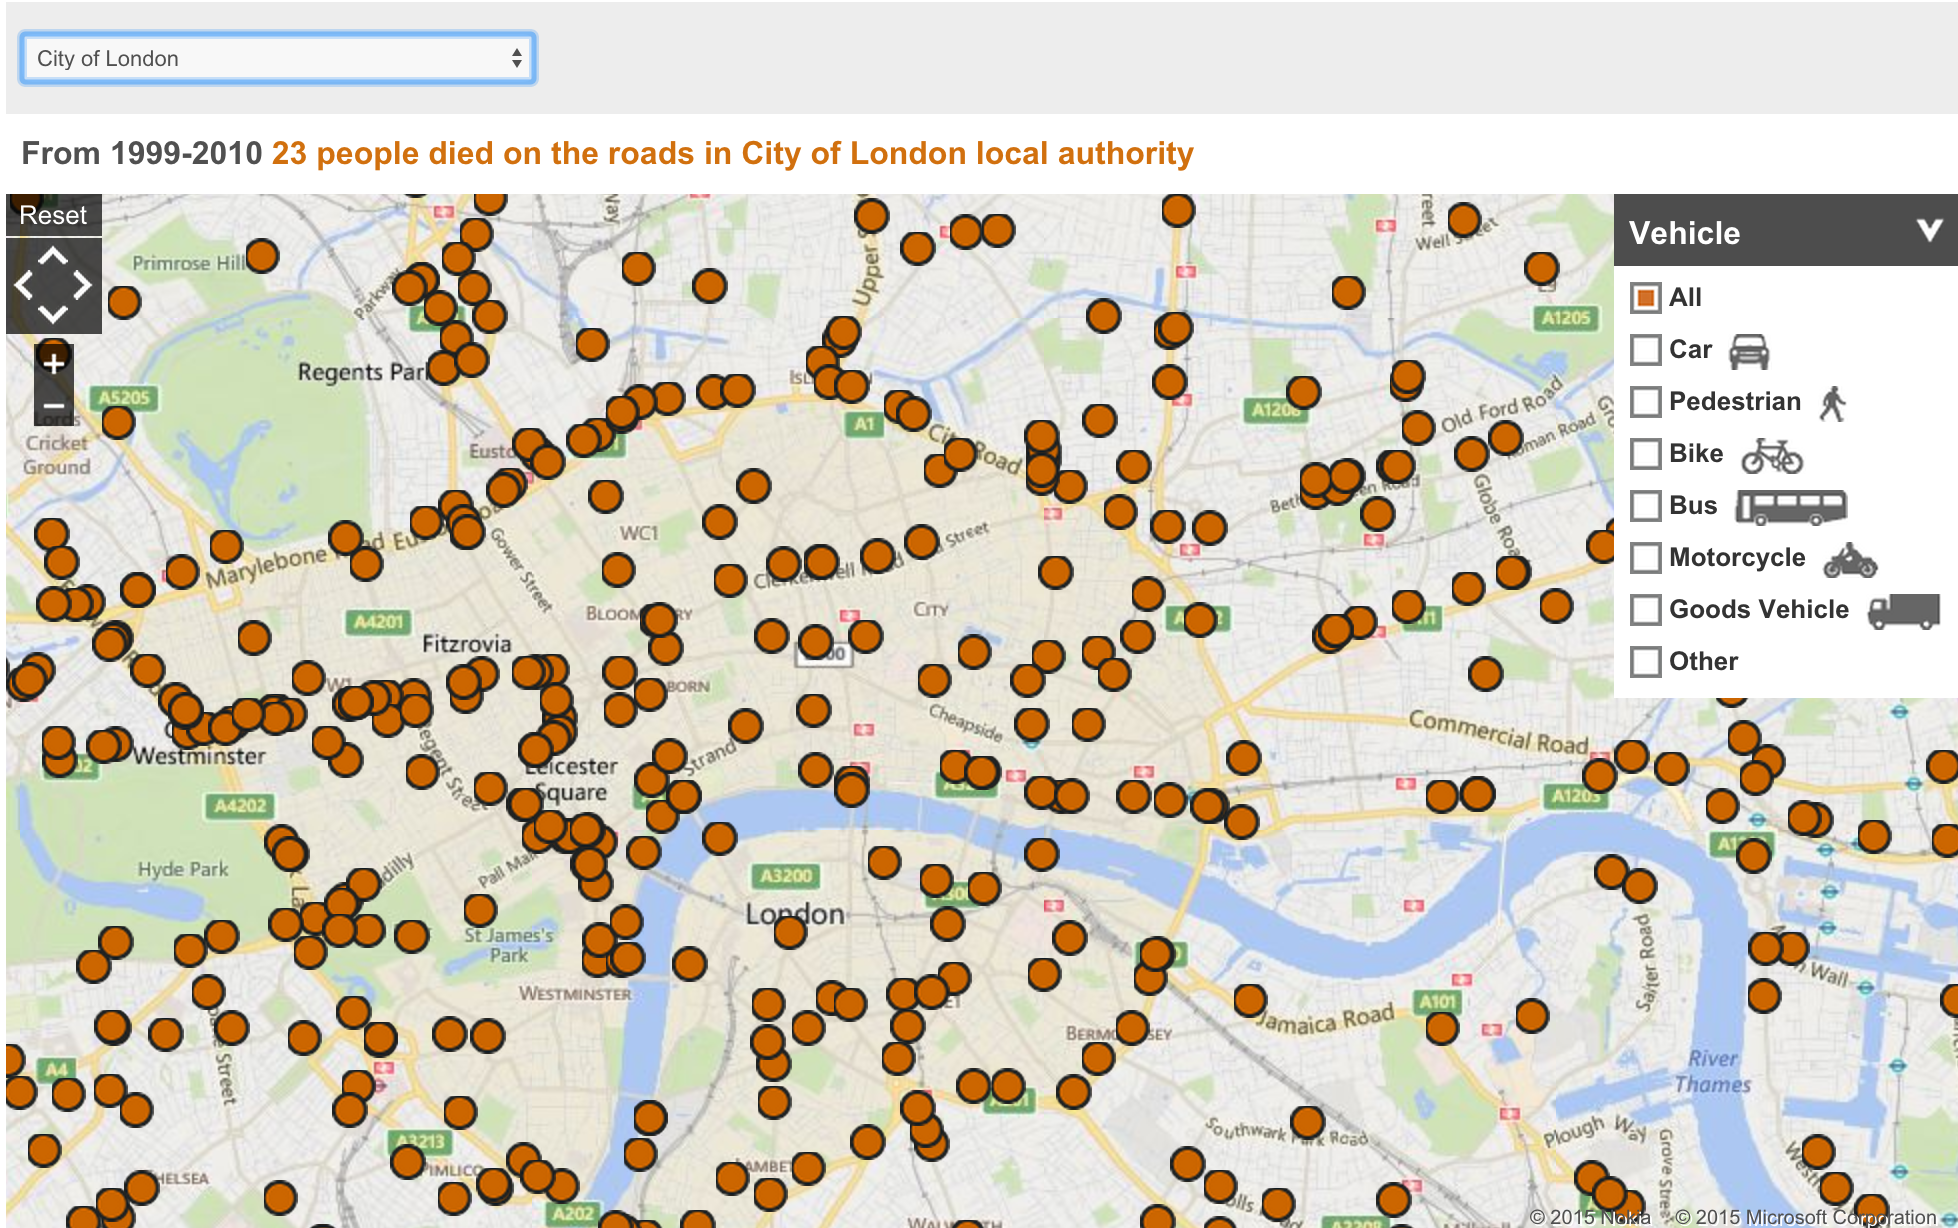 Map results
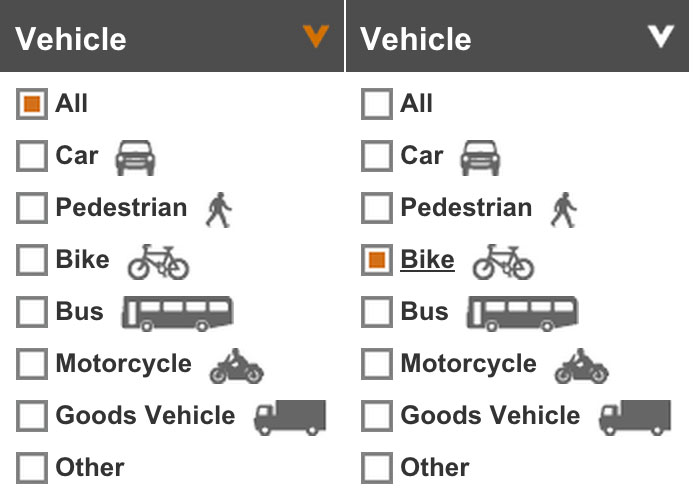
Map Filter allows user to look at all road crashes or by type of vehicle. For simplicity we restricted the filtering to one type of vehicle (radio buttons) this meant we didn’t need to introduce a colour coding convention or iconography. There is also no correlation between vehicle type and location within one particular place.
Map: http://www.bbc.co.uk/news/uk-15975720
All crashes in the UK: 1999 – 2010
 Crash data visualised with time lapse maps: Video here http://www.bbc.co.uk/news/uk-15975724
Graphics highlighting the key stories in the data